An internal control is defined as a process effected by an entity’s oversight body, management, and other personnel, designed to provide reasonable assurance that the objectives of an entity will be achieved (U.S. Government Accountability Office 2025b, 6). The goal of an auditor is to obtain sufficient appropriate audit evidence about the operating effectiveness of relevant internal controls (U.S. Government Accountability Office 2025a, sec. 450.01).
Methods of the Financial Audit Manual Section 450
To determine the operating effectiveness of internal controls, auditors have relied on Figure 450.1 of the Financial Audit Manual Volume 1 (U.S. Government Accountability Office 2025a, sec. 450.09). This table provides the sample size and number of allowed deviations, before which an auditor can declare that the controls are effective.
Written in terms of statistical hypothesis testing, we have the following null and alternative hypotheses, respectively:
H_0: The internal controls are ineffective, e.g., the population deviation rate is greater than or equal to some a priori specified tolerable rate.
H_a: The internal controls are effective, e.g., the population deviation rate is less than the tolerable rate.
Figure 450.1 from the FAM 450 indicates that with a sample size of 45, if an auditor observes zero deviations, they can reject with 90% confidence the null hypothesis that the population deviation rate is greater than the tolerable rate of 5%, and declare the controls effective. On the other hand, if an auditor observes even one deviation in the sample, they will fail to reject the null hypothesis that the controls are ineffective. This wording is very important because failing to reject the null hypothesis is not the same as being able to claim the controls are ineffective—an auditor who observes even one deviation cannot declare that the controls are ineffective. This is analogous to how courts declare someone not guilty due to lack of evidence, rather than declaring them innocent.
We can illustrate the inherent logical fallacy of declaring controls ineffective using basic arithmetic. In the example above, declaring the controls ineffective based on 1/45 deviations implies a claim that the population deviation rate exceeds 5%. However, 1/45 is approximately 2.2%—a point estimate well below the tolerable rate. In statistical hypothesis testing, to reject a null hypothesis of effectiveness (i.e., to prove ineffectiveness), the observed deviation rate must be significantly greater than 5%. As shown in the next section, an auditor would need at least 5/45 (11.1%) failures to statistically justify a claim of ineffectiveness at this level. This same logic applies to every combination sample size and accepted number of deviations in Figure 450.1. Therefore, any assertion in FAM 450 (e.g., sections 450.17 and 450.18) that failing these criteria proves a control is ‘ineffective’ is statistically technically incorrect.
Updated Statistical Methods for the Financial Audit Manual Section 450
In practice, auditors are rarely interested in the above hypotheses and instead want to determine if there is enough evidence to conclude that the controls are ineffective. This requires reversing the hypotheses and adjusting the sample size calculations accordingly:
H_0: The internal controls are effective, e.g., the population deviation rate is less than or equal to the tolerable rate.
H_a: The internal controls are ineffective, e.g., the population deviation rate is greater than the tolerable rate.
Code
library("reticulate")library("kableExtra")fam450 <-import("fam450")df_py <- fam450$fam450gt()df_py <- df_py$reset_index()df_dict <- df_py$to_dict(orient ="list")df <-py_to_r(df_dict)trdTableRow <-function(ss) { ind =which(df$`Sample Size`== ss)return(c(df[[1]][ind], df[[2]][ind], df[[1]][ind], df[[3]][ind]))}tab =data.frame(rbind(trdTableRow(45), trdTableRow(78), trdTableRow(105), trdTableRow(132), trdTableRow(158)))colnames(tab) <-c("Sample size", "Acceptable Number of Deviations", "Sample Size", "Acceptable Number of Deviations")tab %>%kbl(escape =FALSE, caption ="The number of allowed deviations, after which an auditor has enough evidence to determine the internal controls are ineffective.") %>%add_header_above(c("Tolerable Rate of Deviation 5%"=2, "Tolerable Rate of Deviation 10%"=2)) %>%add_header_above(c("90 Percent Confidence Level"=4))
The number of allowed deviations, after which an auditor has enough evidence to determine the internal controls are ineffective.
90 Percent Confidence Level
Tolerable Rate of Deviation 5%
Tolerable Rate of Deviation 10%
Sample size
Acceptable Number of Deviations
Sample Size
Acceptable Number of Deviations
45
4
45
7
78
6
78
11
105
8
105
15
132
10
132
18
158
11
158
21
For the updated table, we use an exact test of binomial proportions to determine the number of allowed deviations before we can reject the null hypothesis that the true tolerable rate of deviation is less than or equal to the specified threshold (Rosner 2016, 252–53; Copeland 2026). The algorithm works as follows, given the hypothesized tolerable rate of deviation p, the sample size n, and the confidence level c:
Let i be the number of observed deviations.
Under the null hypothesis that \frac{i}{n} \le p, we calculate the probability of observing \frac{i}{n} or more extreme, also called the p-value.
If the calculated p-value is less than 1-c, we reject the null hypothesis in favor of the alternative that \frac{i}{n} > p.
The number of allowed deviations is the value i-1 such that if we observe this number of deviations or fewer, we will always fail to reject the null hypothesis.
These methods can be analogously applied to reproduce the original results in Figure 450.1, providing confirmation that the statistical methods used here match the intent of the original FAM 450. However, the updated methods provide a more accurate and statistically sound framework for auditors to determine the effectiveness of internal controls.
-----
fam450              0.1.2
session_info        v1.0.1
-----
Python 3.14.2 (main, Dec  5 2025, 16:49:16) [Clang 17.0.0 (clang-1700.6.3.2)]
macOS-26.3.1-arm64-arm-64bit-Mach-O
-----
Session information updated at 2026-03-28 16:00
R
Code
sessionInfo()
R version 4.5.2 (2025-10-31)
Platform: aarch64-apple-darwin25.0.0
Running under: macOS Tahoe 26.3.1

Matrix products: default
BLAS:   /opt/homebrew/Cellar/openblas/0.3.31/lib/libopenblasp-r0.3.31.dylib
LAPACK: /opt/homebrew/Cellar/r/4.5.2_1/lib/R/lib/libRlapack.dylib;  LAPACK version 3.12.1

locale:
[1] C.UTF-8/C.UTF-8/C.UTF-8/C/C.UTF-8/C.UTF-8

time zone: America/New_York
tzcode source: internal

attached base packages:
[1] stats     graphics  grDevices datasets  utils     methods   base

other attached packages:
[1] kableExtra_1.4.0  reticulate_1.44.1

loaded via a namespace (and not attached):
 [1] svglite_2.2.1      cli_3.6.5          knitr_1.50         rlang_1.1.6
 [5] xfun_0.53          stringi_1.8.7      png_0.1-8          renv_1.1.7
 [9] textshaping_1.0.4  jsonlite_2.0.0     glue_1.8.0         htmltools_0.5.8.1
[13] scales_1.4.0       rmarkdown_2.30     grid_4.5.2         evaluate_1.0.5
[17] fastmap_1.2.0      yaml_2.3.12        lifecycle_1.0.4    stringr_1.5.2
[21] compiler_4.5.2     RColorBrewer_1.1-3 Rcpp_1.1.0         rstudioapi_0.17.1
[25] systemfonts_1.3.1  farver_2.1.2       lattice_0.22-7     digest_0.6.37
[29] viridisLite_0.4.2  R6_2.6.1           magrittr_2.0.4     Matrix_1.7-4
[33] tools_4.5.2        xml2_1.4.0
References
Copeland, Wade K. 2026. “fam450: A Python package to calculate the number of allowed deviations for tests of internal control effectiveness or ineffectiveness.”https://pypi.org/project/fam450/.
---title: "Improved Statistical Methods for Financial Audit Manual Section 450: A Corrected Approach to Internal Control Testing"author: "Wade K. Copeland"date: last-modifieddate-format: "MMMM DD, YYYY"output-file: index.htmlbibliography: references.bibformat: html: embed-resources: true code-overflow: wrap page-layout: full code-fold: true toc: false toc-location: left toc-depth: 4 toc-expand: 4 html-math-method: katex code-tools: source: true toggle: true caption: "Code Tools"number-sections: falseappendix-style: plainengine: jupyterknitr: opts_knit: root.dir: "./"---## IntroductionAn internal control is defined as a process effected by an entity’s oversight body, management, and other personnel, designed to provide reasonable assurance that the objectives of an entity will be achieved [@greenbook_2025, p. 6]. The goal of an auditor is to obtain sufficient appropriate audit evidence about the operating effectiveness of relevant internal controls [@fam450_2025, sec. 450.01].## Methods of the Financial Audit Manual Section 450To determine the operating effectiveness of internal controls, auditors have relied on Figure 450.1 of the Financial Audit Manual Volume 1 [@fam450_2025, sec. 450.09]. This table provides the sample size and number of allowed deviations, before which an auditor can declare that the controls are effective. 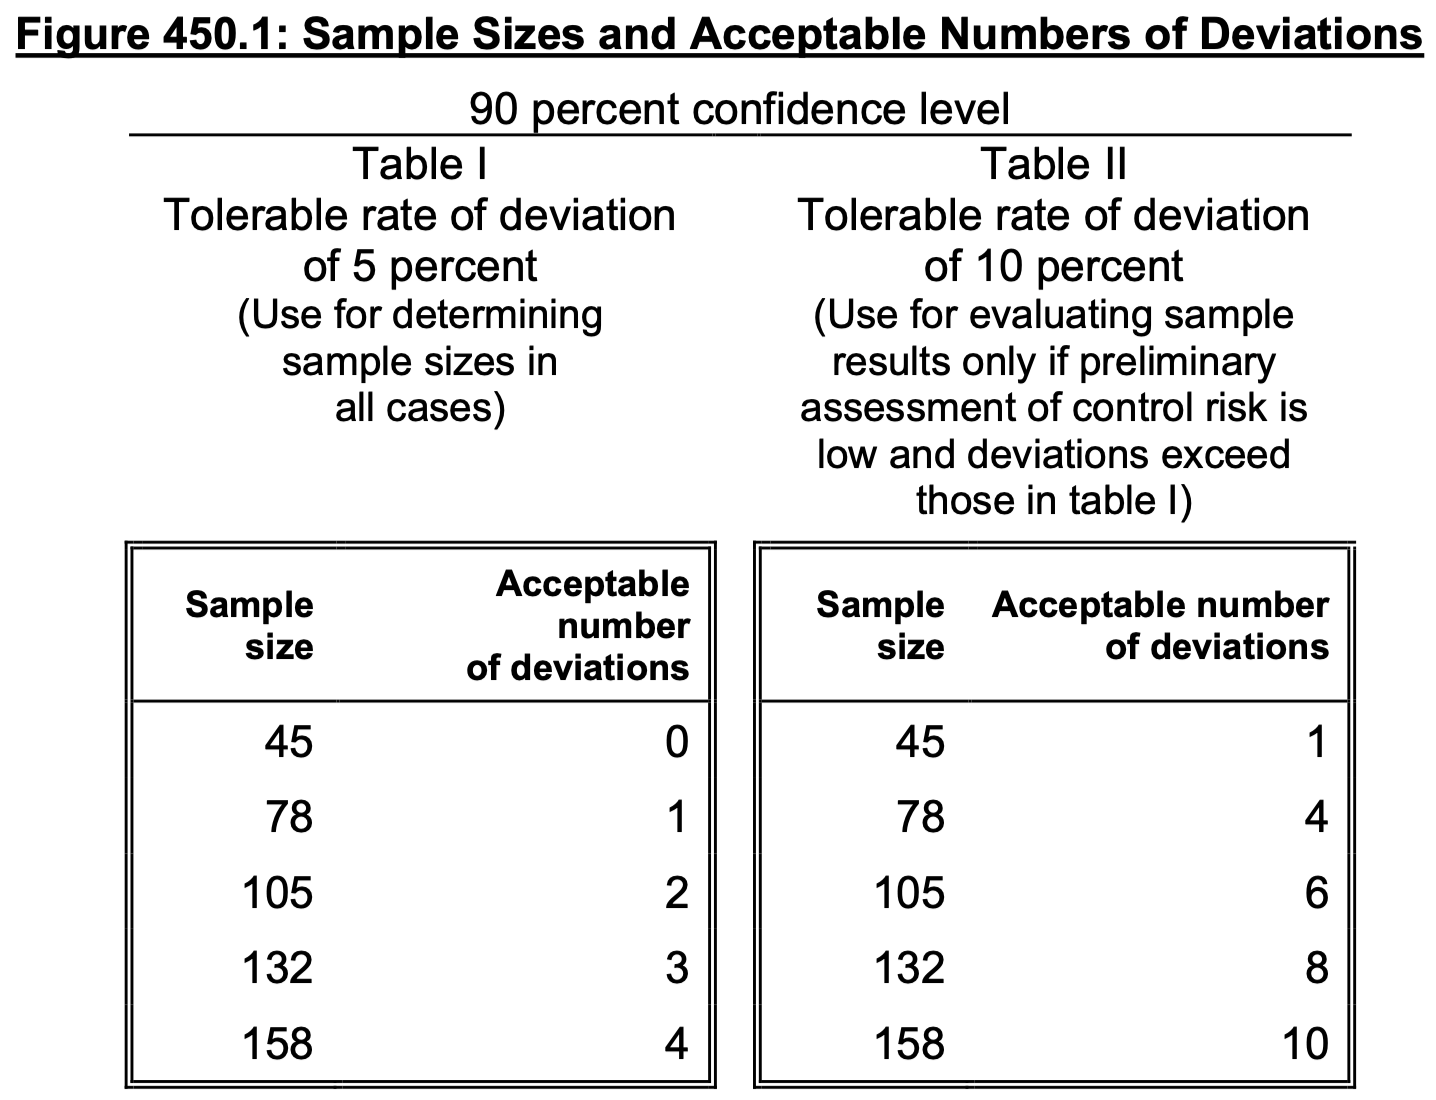{width=400, height=400}Written in terms of statistical hypothesis testing, we have the following null and alternative hypotheses, respectively:* $H_0$: The internal controls are ineffective, e.g., the population deviation rate is greater than or equal to some _a priori_ specified tolerable rate.* $H_a$: The internal controls are effective, e.g., the population deviation rate is less than the tolerable rate.Figure 450.1 from the FAM 450 indicates that with a sample size of 45, if an auditor observes zero deviations, they can reject with 90% confidence the null hypothesis that the population deviation rate is greater than the tolerable rate of 5%, and declare the controls effective. On the other hand, if an auditor observes even one deviation in the sample, they will _fail to reject the null hypothesis_ that the controls are ineffective. This wording is very important because failing to reject the null hypothesis is __not__ the same as being able to claim the controls are ineffective—_an auditor who observes even one deviation cannot declare that the controls are ineffective_. This is analogous to how courts declare someone not guilty due to lack of evidence, rather than declaring them innocent.We can illustrate the inherent logical fallacy of declaring controls ineffective using basic arithmetic. In the example above, declaring the controls ineffective based on 1/45 deviations implies a claim that the population deviation rate exceeds 5%. However, 1/45 is approximately 2.2%—a point estimate well below the tolerable rate. In statistical hypothesis testing, to reject a null hypothesis of effectiveness (i.e., to prove ineffectiveness), the observed deviation rate must be significantly greater than 5%. As shown in the next section, an auditor would need at least 5/45 (11.1%) failures to statistically justify a claim of ineffectiveness at this level. This same logic applies to every combination sample size and accepted number of deviations in Figure 450.1. Therefore, any assertion in FAM 450 (e.g., sections 450.17 and 450.18) that failing these criteria proves a control is 'ineffective' is statistically technically incorrect.## Updated Statistical Methods for the Financial Audit Manual Section 450In practice, auditors are rarely interested in the above hypotheses and instead want to determine if there is enough evidence to conclude that the controls are ineffective. This requires reversing the hypotheses and adjusting the sample size calculations accordingly:* $H_0$: The internal controls are effective, e.g., the population deviation rate is less than or equal to the tolerable rate.* $H_a$: The internal controls are ineffective, e.g., the population deviation rate is greater than the tolerable rate.```{r}#| label: fam450-corrected#| eval: true#| echo: true#| output: true#| warning: false#| message: falselibrary("reticulate")library("kableExtra")fam450 <-import("fam450")df_py <- fam450$fam450gt()df_py <- df_py$reset_index()df_dict <- df_py$to_dict(orient ="list")df <-py_to_r(df_dict)trdTableRow <-function(ss) { ind =which(df$`Sample Size`== ss)return(c(df[[1]][ind], df[[2]][ind], df[[1]][ind], df[[3]][ind]))}tab =data.frame(rbind(trdTableRow(45), trdTableRow(78), trdTableRow(105), trdTableRow(132), trdTableRow(158)))colnames(tab) <-c("Sample size", "Acceptable Number of Deviations", "Sample Size", "Acceptable Number of Deviations")tab %>%kbl(escape =FALSE, caption ="The number of allowed deviations, after which an auditor has enough evidence to determine the internal controls are ineffective.") %>%add_header_above(c("Tolerable Rate of Deviation 5%"=2, "Tolerable Rate of Deviation 10%"=2)) %>%add_header_above(c("90 Percent Confidence Level"=4))```For the updated table, we use an exact test of binomial proportions to determine the number of allowed deviations before we can reject the null hypothesis that the true tolerable rate of deviation is less than or equal to the specified threshold [@rosner2016fundamentals, pp. 252-253; @copeland2026fam450]. The algorithm works as follows, given the hypothesized tolerable rate of deviation $p$, the sample size $n$, and the confidence level $c$:1. Let $i$ be the number of observed deviations.2. Under the null hypothesis that $\frac{i}{n} \le p$, we calculate the probability of observing $\frac{i}{n}$ or more extreme, also called the p-value.3. If the calculated p-value is less than $1-c$, we reject the null hypothesis in favor of the alternative that $\frac{i}{n} > p$.4. The number of allowed deviations is the value $i-1$ such that if we observe this number of deviations or fewer, we will always fail to reject the null hypothesis.These methods can be analogously applied to reproduce the original results in Figure 450.1, providing confirmation that the statistical methods used here match the intent of the original FAM 450. However, the updated methods provide a more accurate and statistically sound framework for auditors to determine the effectiveness of internal controls.## Session Information {#sec-sessioninfo}All of the files needed to reproduce these results can be downloaded from the Git repository <https://github.com/wkingc/fam450-corrected-py>.### Python```{python}import fam450import session_infosession_info.show()```### R```{r session_info}sessionInfo()```# References
